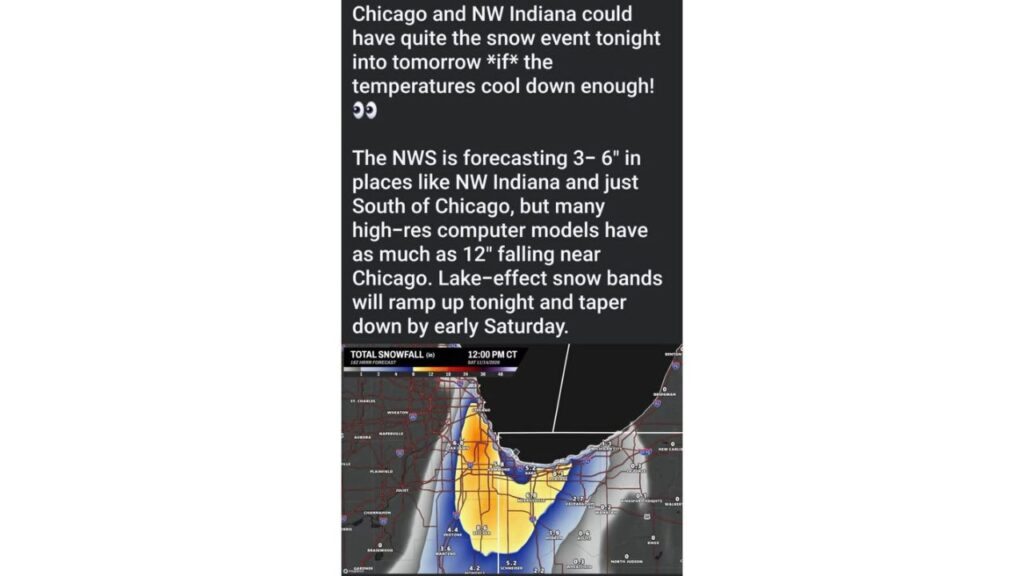
Chicago and Northwest Indiana Lake-Effect Snow Sparks Hype Debate as Viral Maps Show Up to 12 Inches, While Forecasters Warn Melting Will Cut Totals
CHICAGO, ILLINOIS — A lake-effect snow event targeting Chicago and northwest Indiana from Friday night, November 13, 2026, into early Saturday has sparked more than snow. It has also set off a debate among weather watchers about overhyping forecasts on social media.
The Forecast Behind the Buzz
| Source | Expected Snow |
|---|---|
| National Weather Service | 3 to 6 inches in northwest Indiana and just south of Chicago |
| Some high-resolution models | As much as 12 inches near Chicago |
| Earlier realistic estimates | 1 to 3 inches on grassy and elevated surfaces |
Lake-effect bands are expected to ramp up Friday night and taper off by early Saturday.
What the Viral Map Shows
A widely shared map of total snowfall through noon CT Saturday, November 14, showed eye-catching numbers across the area:
| Location | Snow on the Map |
|---|---|
| Beecher, Illinois | 8.6 inches |
| Portage, Indiana | 8.1 inches |
| Oak Lawn, Illinois | 6.8 inches |
| Merrillville, Indiana | 6.8 inches |
| Hammond, Indiana | 5.8 inches |
| Gary, Indiana | 5.2 inches |
| Schneider, Indiana | 5.2 inches |
| Peotone, Illinois | 4.4 inches |
| Momence, Illinois | 4.2 inches |
| Manteno, Illinois | 3.6 inches |
| Valparaiso, Indiana | 2.7 inches |
| Hebron, Indiana | 1.9 inches |
| Michigan City, Indiana | 1.1 inches |
| Kouts, Indiana | 0.6 inch |
| La Porte and Wheatfield, Indiana | 0.3 inch |
| Braidwood, Knox and North Judson | 0 |
Why Some Forecasters Are Pushing Back
One weather observer criticized both TV meteorologists and social media influencers for sharing model runs that do not account for melting. With warm ground after a mild fall and recent rain, much of the snow could melt on contact, especially on roads.
He argued that the weather community “can do so much better” and suggested some people share the most extreme forecasts mainly to gain attention or make money.
Why Raw Model Maps Can Mislead
Many snowfall maps simply add up all the snow that falls, without subtracting what melts. That can make totals look much higher than what actually piles up, especially early in the season when:
- Ground temperatures are still warm
- Air temperatures hover near freezing
- Snow falls in bursts rather than steadily
The “If” That Matters Most
Even the viral post included an important condition: Chicago and northwest Indiana could see a big event “if” temperatures cool enough. That “if” is a major reason why actual totals may land far below the highest model numbers.
What Residents Should Expect
The most likely outcome is:
- Light to moderate snow in narrow bands
- Accumulations mainly on grass, cars and rooftops
- Wet or slushy roads in heavier bursts
- Higher totals only where a band stalls for several hours
How to Read Snow Forecasts Wisely
- Trust official forecasts from the National Weather Service
- Be cautious with single model screenshots
- Look for ranges, not just the highest number
- Check if maps include melting
Travel Tips for Friday Night and Saturday
- Slow down in sudden heavy snow
- Watch for slick spots on I-80, I-90, I-94 and I-65
- Allow extra time for Saturday morning travel
Stay with Bchssreport.com for the latest updates on this story.
About The Author
